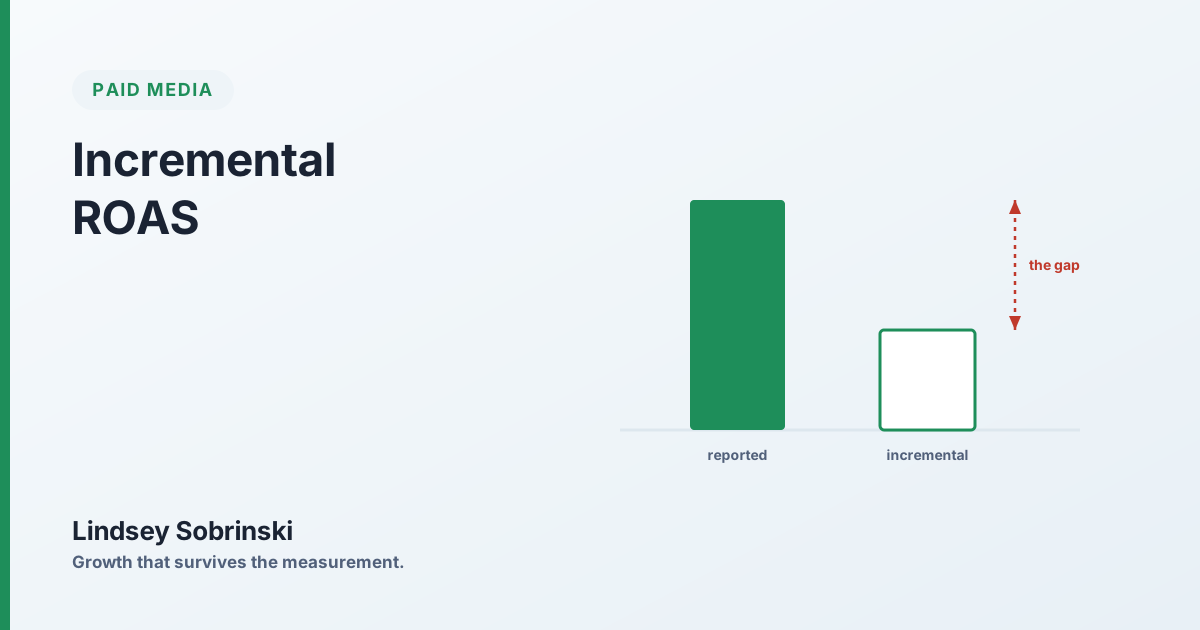
Every platform in your account reports a ROAS, and every one of them is answering the wrong question. Reported ROAS tells you what the platform observed, how much attributed revenue it can associate with the ads it served. The question that actually governs a budget is different: what did the spend cause? That number is incremental ROAS, and the gap between the two is where most media budgets quietly leak.
Two numbers that sound the same and aren’t
Reported ROAS is attributed revenue over spend. If a platform can link a conversion to an impression or a click it served, it counts the revenue. Simple, fast, and structurally generous, because it credits the ad for conversions that were going to happen regardless.
Incremental ROAS is caused revenue over spend. It counts only the conversions that would not have occurred without the ad. Everything the campaign merely intercepted, the retargeted cart that was coming back anyway, the branded searcher who already knew your name, the loyal customer mid-repurchase, gets stripped out. What’s left is the revenue the spend actually produced.
Same shape, opposite meaning. One measures observation; the other measures impact.
Why the gap is usually enormous
The gap between reported and incremental ROAS is the demand that already existed. And on the channels that report the best ROAS, that’s most of the number.
Think about where reported ROAS looks strongest: branded search, retargeting, bottom-of-funnel social. Those are exactly the placements that advertise to people already in motion. High reported ROAS on those channels isn’t a sign of high impact, it’s a sign of high pre-existing intent in the audience. The ad showed up at the finish line and claimed the race. Run the incrementality test and a big share of that revenue turns out to have been arriving with or without the spend.
Reported ROAS is highest exactly where incrementality is lowest, the bottom of the funnel, where the ad intercepts demand it didn’t create. The prettiest number in the account is often the least incremental.
How you actually measure it
You can’t compute incrementality from a dashboard, because the dashboard only sees the exposed group. You need a comparison, a set of people or markets that didn’t see the ad, and the difference between them is the lift.
Three practical ways to build that comparison:
Geographic holdout. Run the channel in a set of matched markets and hold it dark in another set. Compare total outcomes. This is the workhorse for channels with no click to measure, like CTV and out-of-home.
Audience suppression. Withhold ads from a random slice of otherwise-eligible users and compare their conversion rate to the exposed group. This is how you test retargeting and branded search honestly.
Platform lift study. The ad platforms offer their own randomized lift tests. Useful, with the caveat that you’re asking the platform to grade itself, worth triangulating against your own geo tests.
Whichever you use, the logic is the same: measure the difference between exposed and unexposed, attribute that difference to the spend, divide. The comparison group is the entire ballgame.
Translate it into the number that matters
iROAS by itself still isn’t the decision. There’s no universal “good” iROAS, because it has to clear your margin, not a benchmark. The move is to convert incremental revenue into contribution: at your contribution margin, does the demand this spend actually created exceed what it cost?
That reframing changes which campaigns look like winners. A channel with a modest iROAS on high-margin products can beat one with a flashier iROAS on thin-margin goods. Revenue-based ROAS targets hide this; incrementality plus margin exposes it. This is the same discipline the Measurement lane applies across the whole plan, and it’s why branded search deserves its own holdout before you trust its reported return.
The takeaway
Reported ROAS is fine for steering day to day. It is not fine as the basis for a budget decision, because it systematically over-credits the spend that intercepts existing demand and under-credits the spend that creates it. Build the comparison group, measure the lift, translate it to contribution, and put that number in front of finance. It’ll be lower than the dashboard’s. It’ll also be the first return figure in the room that survives the follow-up question.