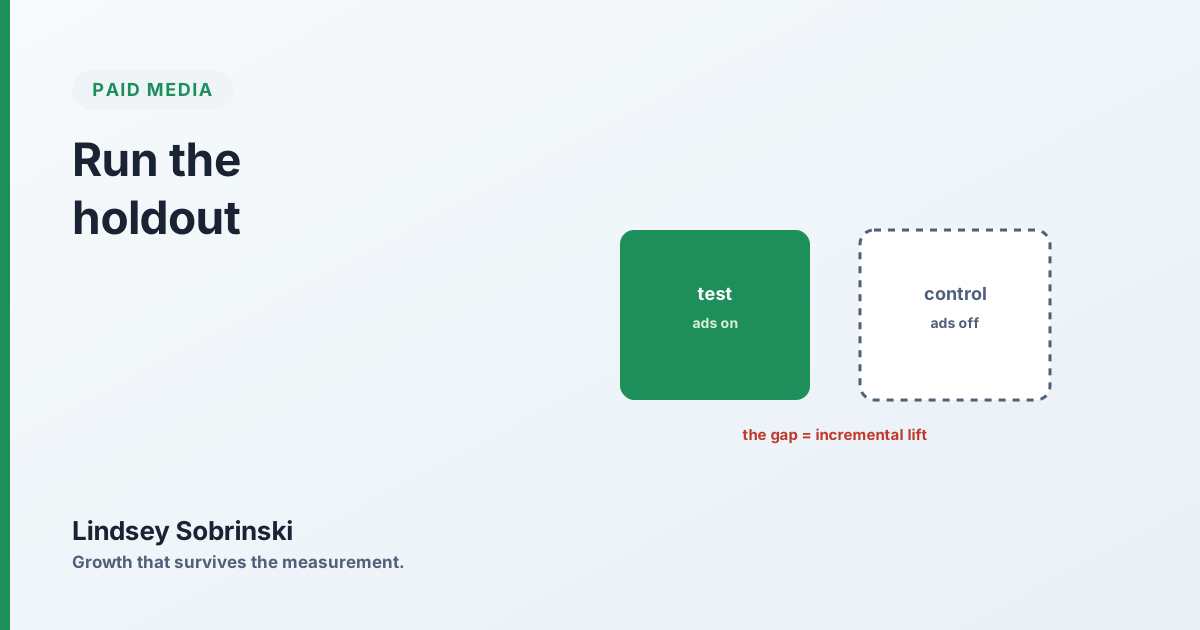
To run a geo holdout test, split comparable markets into a test group that gets the media and a matched control group that does not, confirm the two tracked together in a pre-period, run it long enough to clear the channel’s lag, then measure the gap against the control. That gap is the incremental lift the media caused.
Every measurement post, including mine, tells you to run a holdout. Far fewer explain how to design one that actually gives a trustworthy answer, which matters, because a badly designed incrementality test is worse than no test. It launders a wrong number into a confident one, and then you make budget decisions on it.
Here’s the practical method, and the specific ways these tests quietly fool the people running them.
The core idea: build the comparison the platform can’t
Incrementality is the revenue that wouldn’t have happened without the spend. You can’t see it in a dashboard, because the dashboard only shows the people who were exposed. A geo holdout manufactures the missing half: it runs the channel in one set of markets (test) and holds it off in a matched set (control), so the only planned difference between them is the media. Whatever difference shows up in outcomes is the lift the media caused.
Everything that makes a geo test trustworthy or worthless comes down to one question: are your test and control markets actually comparable, so that without the media change you’d expect them to move together? Get that right and the rest is arithmetic. Get it wrong and no amount of clever analysis saves you.
Step 1: match the markets
Choose test and control markets that behaved alike before the test, similar baseline sales trend, similar seasonality, ideally similar size and customer mix. Then prove it with data: pull a pre-period of history and confirm the two groups track in parallel. If test and control were already diverging before you touched anything, they’ll keep diverging during the test, and you’ll credit that drift to your media.
Two things strengthen the match. More markets on each side, so the quirks of any one city average out instead of dominating the read. And parallel movement in the pre-period specifically, not just similar averages, but the two groups rising and falling together, because that parallel relationship is the thing you’ll extrapolate to build your baseline.
Step 2: fix the duration and the metric before you start
Decide up front how long the test runs and exactly what you’re measuring. Duration has to cover the channel’s lag to effect, upper-funnel channels like CTV take time to show up in sales, so a two-week test reads them as dead when they’re just slow, without running so long that seasonality and market drift creep in. Several weeks to a couple of months is a common range, weighted longer for brand and shorter for direct response.
Write the metric down before launch: incremental revenue, incremental orders, incremental new customers, whatever the decision needs. This sounds bureaucratic and it’s actually the guardrail. The most common way honest people produce a false positive is extending the test until it finally shows the answer they were hoping for, then stopping. Pre-committing to duration and metric removes that temptation.
A holdout you can stop whenever the number looks good isn’t a test, it’s a search for the week that flatters you. Fix the endpoint and the metric before launch, or you’ll measure your own hope.
Step 3: read the lift against a real baseline
To calculate the result, first build the counterfactual, what the test markets would have done without the media. The standard way: take the pre-period relationship between test and control and project it forward through the test window. That projection is your baseline. The gap between it and what the test markets actually did is the incremental outcome. Divide incremental revenue by incremental spend and you have incremental ROAS.
The whole rigor lives in that baseline. “Lift” is meaningless without a defensible answer to “compared to what?” A number that compares actual results to a sloppy baseline is just a sloppy baseline wearing a lift’s clothing.
The ways these tests go wrong
Almost every untrustworthy geo test fails at design, not analysis. The recurring culprits:
Mismatched markets. Test and control weren’t comparable to begin with, so their natural divergence gets read as media effect. The number-one failure.
Too short. The test ended before the channel’s impact had time to appear, especially for upper-funnel media. You conclude “no lift” when you measured “not yet.”
Spillover. Test-market media, shipping, or word of mouth bleeds into control markets, adjacent cities, national press, a promo that ignores your geo lines, shrinking the apparent gap.
A seasonal or external shock that hits one group harder: a weather event, a regional holiday, a competitor’s store opening. It masquerades as your media’s effect.
Moving the goalposts. Changing the metric, the markets, or the end date once results start coming in. Each adjustment biases the answer toward what you expected.
The defense against all of them is the same: design the entire test, markets, duration, metric, analysis method, before it launches, and treat a too-good-to-be-true result as a prompt to re-check the design rather than a reason to celebrate. Incrementality is worth doing precisely because it’s the one number that survives a budget conversation. It only earns that status if the test underneath it was honest with itself first.
Start small, but start
You don’t need a perfect experimental apparatus to begin. Pick your most-argued-about channel, the one whose reported ROAS nobody quite believes, match a handful of markets on each side, fix a duration and a metric, and run it. The first honest holdout you run will teach you more about your media plan than a year of dashboards, because it answers the one question dashboards can’t: not what happened alongside the spend, but what happened because of it.
Not sure you even need a vendor yet? Pilot it first: run a geo-holdout pilot before you sign a measurement contract.