Pull your top channel’s ROAS. Now ignore it. It’s an average, and averages are where scaling decisions go to die.
Here’s the trap. A channel posts a 5x. Leadership says fund it. You move another $50k in and watch efficiency sag, and nobody can explain why the “winner” got worse the moment you believed in it. The answer is that the 5x described money you already spent. It said nothing about the money you were about to.
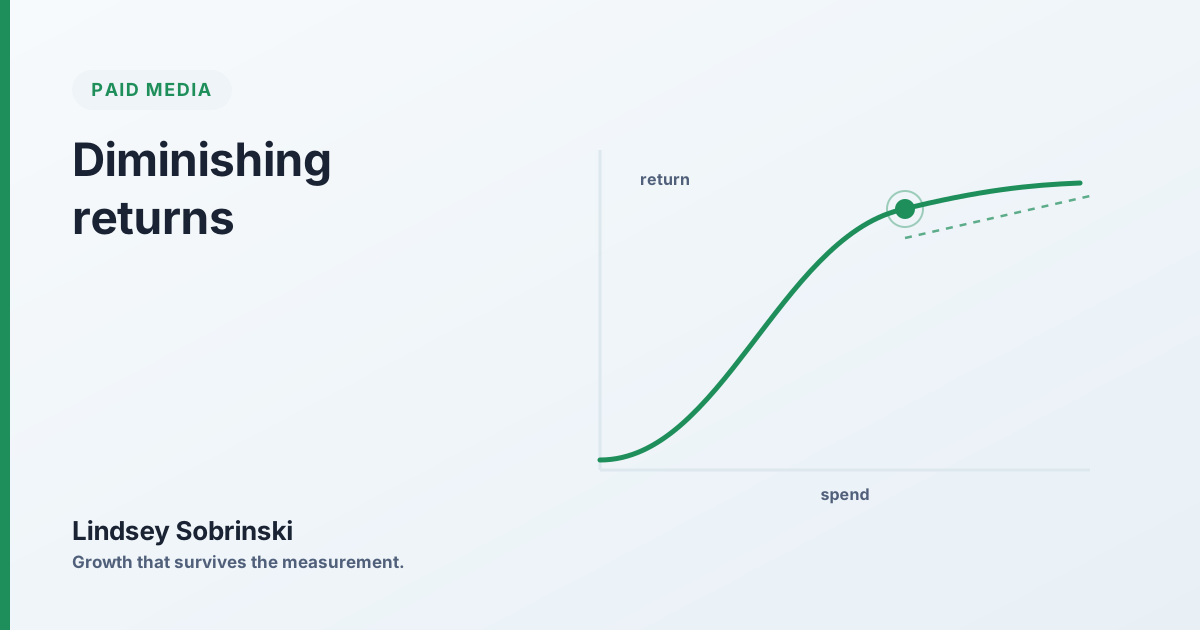
Every channel has a response curve. Early dollars buy your cheapest, most-qualified demand, people already leaning in, reached at low frequency, won in uncontested auctions. That demand is finite. As you scale, three things happen at once: the audience saturates, so you pay to reach the same people more often; frequency fatigue sets in, so each impression converts worse; and the auction price rises as the platform stretches to less-qualified users to spend your budget. The curve flattens. Sometimes it rolls over entirely.
Average is the curve, marginal is the slope
Average ROAS is the whole curve. Marginal ROAS is the slope where you’re standing. Those are different numbers, and only one of them answers “should I add budget here.” A channel at a 5x blended average can be returning 1.2x on its next dollar. You’ll never see that in the platform dashboard, because the dashboard is proudly averaging the cheap conversions from six weeks ago into today’s expensive ones.
The scaling question is never “which channel has the best ROAS.” It’s “which channel returns the most on the next dollar.” Those rankings routinely invert. Your saturated hero returns less at the margin than a mid-tier channel with room left on its curve. Fund the average and you overspend the hero and starve the channel that could actually absorb growth efficiently.
Find the inflection by provoking it
So find the inflection. Don’t infer it, provoke it. Steady-state reporting won’t reveal the slope, because nothing is changing. You have to change spend on purpose and read the response.
Step a channel up 20-30%, hold everything else constant, and measure incremental revenue against incremental spend. That ratio is your marginal ROAS at the current level. Do it again at the new level and you’ve got two points on the curve and a direction. Run the same play down and you’ll find the floor you can cut to without losing efficient volume.
Geo tests make this clean. Hold budget flat in matched markets, scale in the rest, and the gap is your incremental lift uncontaminated by seasonality or platform self-reporting. A properly calibrated MMM hands you the full response curve and the saturation point directly, if you trust the model and it’s fed real spend variation. Most aren’t, because most media plans hold spend suspiciously stable, which starves the model of the signal it needs. Variance is not noise. It’s how you learn the curve.
The indicators that move before ROAS does
And watch the leading indicators, because they move before ROAS does. Frequency climbing while conversion rate slips means you’re re-serving a tapped-out audience. Effective CPM rising at flat outcomes means the auction is reaching past your qualified pool. Both show up weeks ahead of the efficiency drop they cause. By the time blended ROAS visibly cracks, you’ve been overspending past the frontier for a month.
The discipline that follows is reallocation, not accumulation. Rank channels by remaining marginal return, not by average. Move the next dollar to the steepest slope you’ve got, the channel where an added $10k still buys efficient volume, and pull budget off anything flattened past its efficient frontier. This feels wrong. You’re cutting a “winner” and funding something with a lower headline number. Do it anyway. You’re not grading past performance. You’re buying the next unit of growth at the best available price.
What to do first
Take your three largest channels. For each, run a deliberate 25% spend step-change over two weeks, hold the rest of the plan flat, and compute incremental revenue over incremental spend. That single number, marginal ROAS, reranks your channels immediately, and it will not match your average-ROAS ranking. Then move budget toward the steepest remaining slope and away from anything where frequency and CPM are climbing into flat conversions.
Average ROAS tells you where the money went. Marginal ROAS tells you where it should go next. Only one of those is a decision.