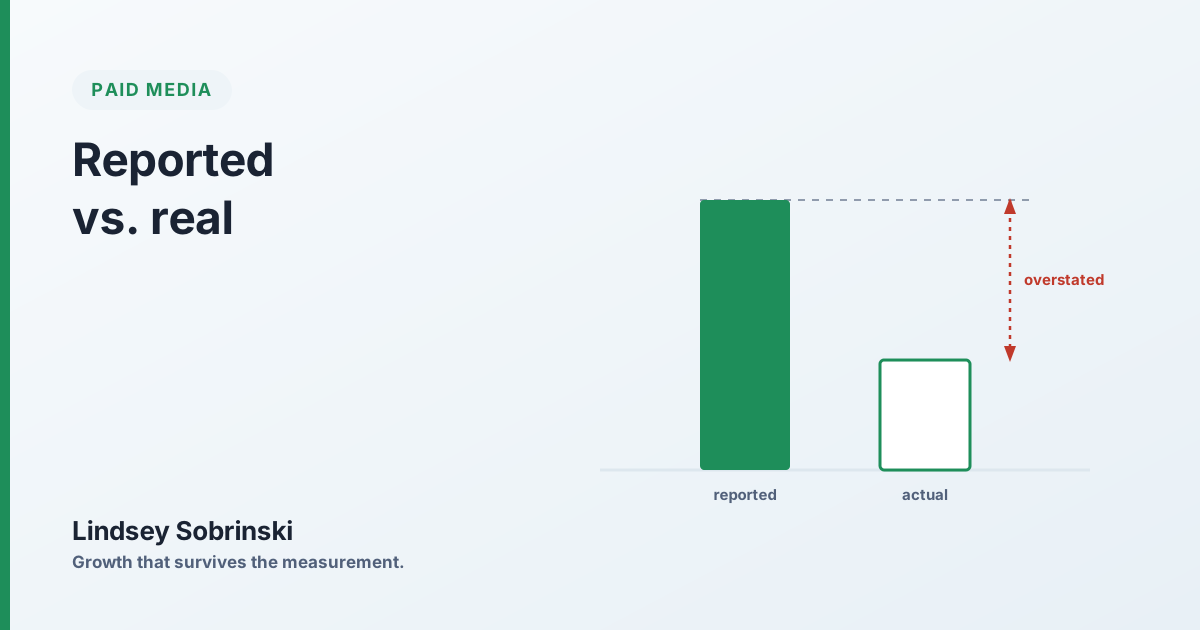
There is a diagnostic that takes about ten minutes and tells you most of what you need to know about your measurement. Pull the revenue each ad platform reported last quarter. Add it up. Compare it to what the company actually booked.
If the platforms claim more revenue than the business earned, you are not looking at a reporting bug. You are looking at the structural condition of platform attribution, and every budget decision made on those numbers inherited it.
Why the numbers overlap
An ad platform can only observe conversions it can associate with an impression or click it served. That is a reasonable thing for it to report and an unreasonable thing to run a business on, for three reasons.
It cannot see the counterfactual. The platform has no view of what the buyer would have done without the ad. A customer who was going to purchase anyway, saw a retargeting ad on the way, and converted is counted as a full win.
It cannot see the other platforms. Two channels touching the same buyer will both claim the conversion. Neither is lying by its own rules. The rules just do not compose.
It is optimizing toward what it can see. Delivery systems find the users most likely to convert, which frequently means the users already intending to. The system then reports the resulting conversions as evidence it worked.
The net effect is a bias toward whichever channels are best at observing conversions, usually branded search and retargeting, and away from the channels that generated the demand those channels intercepted.
What incrementality actually asks
Incremental ROAS asks a narrower and harder question: what is the return on revenue that would not have happened otherwise?
Answering it requires a comparison group. There is no way around that, and no amount of modeling on observational data substitutes for one.
Geo holdouts
Split markets into test and control, suppress spend in control, and read the difference in total business outcomes. Cleanest option for channels without clean user-level tracking, and the only honest way to evaluate CTV, audio, and out-of-home.
Audience suppression
Withhold a randomized share of an addressable audience. Well suited to retargeting and lifecycle, which is fortunate, because those are the channels where inflated reporting is most common.
Platform lift studies
Cheapest to run and worth using, with the caveat that you are asking a party to grade itself under rules it wrote. Useful directionally, weak as sole evidence for a major reallocation.
The result is usually uncomfortable
The common finding is that retargeting and branded search are substantially less incremental than reported, and that upper-funnel channels are doing more than they were credited for. This is uncomfortable because it inverts the internal scoreboard, and the channels that look worst under scrutiny are typically the ones someone has been reporting as wins for years.
It is also the finding that unlocks growth, because it means there is underexploited capacity in channels the current measurement was systematically undervaluing.
What to do first
Start with one test on the channel carrying the most spend with the weakest causal evidence. That is almost always retargeting or branded search. Size it so the result is unambiguous, run it long enough to clear the purchase cycle, and agree in advance what result would change the budget, before anyone has seen the outcome and started negotiating with it.
Then calibrate. Tests give you causal truth about a narrow window; a mix model gives you continuous allocation across everything. Using the first to anchor the second is the structure that holds up over time.
The goal is not to prove any channel wrong. It is to be able to answer, in a room with a CFO, how you know.
Related: Default on: your ad platforms are making decisions you never approved