Most subscription businesses can quote their LTV to CAC ratio. Fewer can quote their cohort payback period, and the second number is the one that decides what the business is allowed to do next.
The ratio tells you whether a customer is worth acquiring. Payback tells you when you get the money back, and therefore how fast you can spend it again. Those are different questions, and only one of them constrains growth.
Two businesses, same ratio, different lives
Take two subscription businesses. Both spend $120 to acquire a customer. Both eventually earn $360 in contribution margin from that customer. Both report 3x LTV to CAC, and both put it on the same slide.
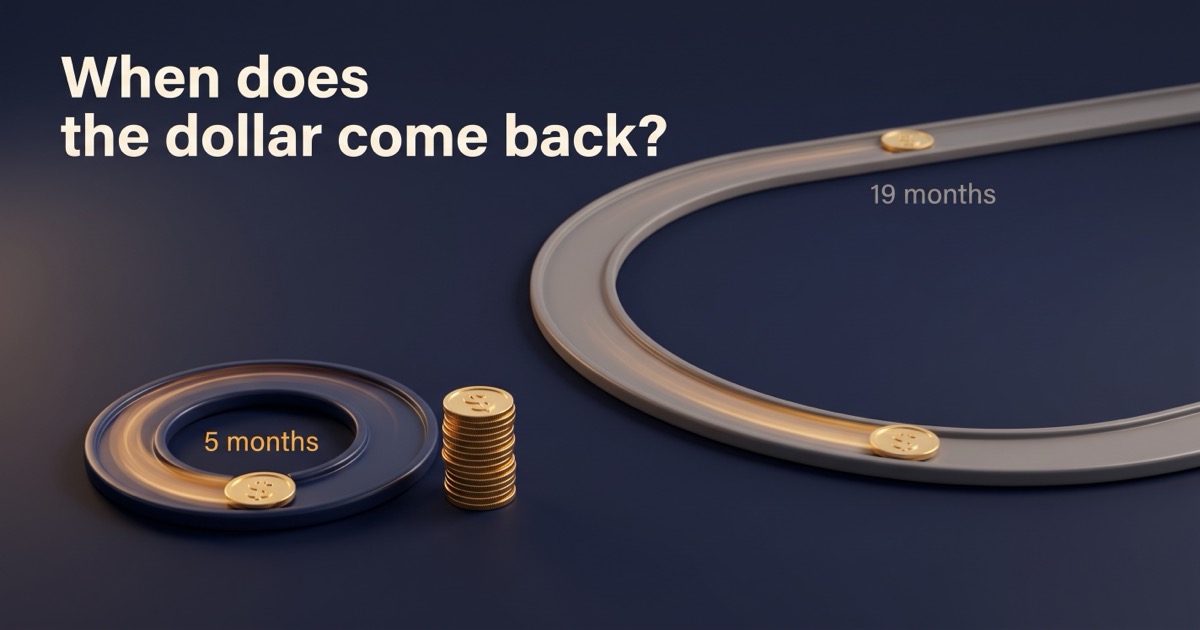
The first has customers who pay monthly and stick: it recovers the $120 in about five months. Each acquisition dollar comes back roughly twice a year and goes straight into the next cohort. Growth is funded by trading.
The second has a longer cycle, a slower ramp, and a heavier early cliff: it recovers the $120 in nineteen months. The lifetime value arrives, eventually, but the dollar is tied up for more than a year and a half before it can be used again. Growth is funded by somebody else, on their terms, at their price.
Those are not the same business. The ratio says they are.
Payback is what turns retention into a growth lever
The reason payback belongs at the center of the conversation is that it is where retention improvements actually show up.
The usual argument for retention work is that it is cheaper than acquisition, which invites lazy conclusions and is not always true. The better argument is structural: an improvement to early retention pulls the cumulative contribution curve left for every future cohort, permanently. It is not a few extra months of revenue tacked on to the end of a customer’s life. It shortens payback on every dollar the business will spend from now on, and it keeps doing that after the quarter ends, which is precisely what a good media quarter does not do.
This is why an activation fix and a media efficiency gain of the same reported size are not equivalent. One compounds into the payback curve and the other expires.
The Cohort Payback Calculator models this directly: set an activation rate, an ongoing retention rate, and a margin, and watch what two points of retention do to the number of cycles before the curve crosses acquisition cost. The effect is larger than most people expect, which is the point of building it.
Why a single churn rate cannot produce this number
Payback depends on how many customers are still present in each cycle, which means it depends on the shape of the retention curve rather than its average.
Real curves are not exponential decay at a constant rate. They drop steeply in the first cycle or two, where activation either worked or did not, and then flatten among the customers who stuck. Modeling that shape with one blended churn rate gets both ends wrong: it understates the early cliff and understates the durability of the survivors, and the two errors do not cancel.
An activation rate plus an ongoing rate is the minimum honest model. It is two numbers instead of one, and it is the difference between a payback figure you can plan against and a figure that happens to be arithmetic.
The number that moves before anything else does
Payback lengthening across successive cohorts is the earliest reliable warning a subscription business gets, and it usually appears well before the churn rate looks alarming.
There are only a few things that cause it: acquisition got more expensive, margin got thinner, or the customers got worse. The third is the most common and the most misdiagnosed, because it presents as a retention problem while being a sourcing decision. When each new cohort retains slightly worse than the last while nothing in the lifecycle program has changed, the lifecycle program is not what broke.
That is why payback should be read by acquisition source rather than in aggregate. A channel judged on cost per acquisition can look excellent while buying customers whose payback never arrives, and the blended curve will average that channel’s damage against everyone else’s good behavior until it is large enough to be a crisis. Splitting the curve is what makes it a budget conversation instead.
Calculate it on margin, and do not discount away the discomfort
Two mechanical notes that decide whether the number is worth anything.
Use contribution margin, after product cost, shipping, fulfillment, and payment fees. Payback on revenue is a number that cannot be spent, and it will flatter the period by exactly the margin rate. When a payback figure sounds impressive, the first question is always which line it was built on.
And treat long paybacks as optimistic rather than precise. A model that counts undiscounted contribution three years out is assuming the customer, the price, and the margin all survive intact. Beyond about eighteen months, the honest reading of a payback curve is directional.
More on the surrounding math in subscription unit economics, and on the retention side of it in churn reduction.
So the question for the next planning cycle is not what your LTV to CAC ratio is. It is how long each acquisition dollar is tied up before you can spend it again, and whether that number is getting shorter or longer.