Add up every “winning” test your team shipped last year. Multiply each claimed lift by its traffic. Now look at your actual, top-line conversion rate over the same period. If the two numbers don’t reconcile, and they almost never do, you have your answer. Most of your wins were noise, and you shipped them anyway.
This is the quiet failure of most CRO programs. Not that they don’t test. That they can’t tell a real lift from a random one, and they’ve built a whole ritual around not noticing.
The graph looks good, so you call it
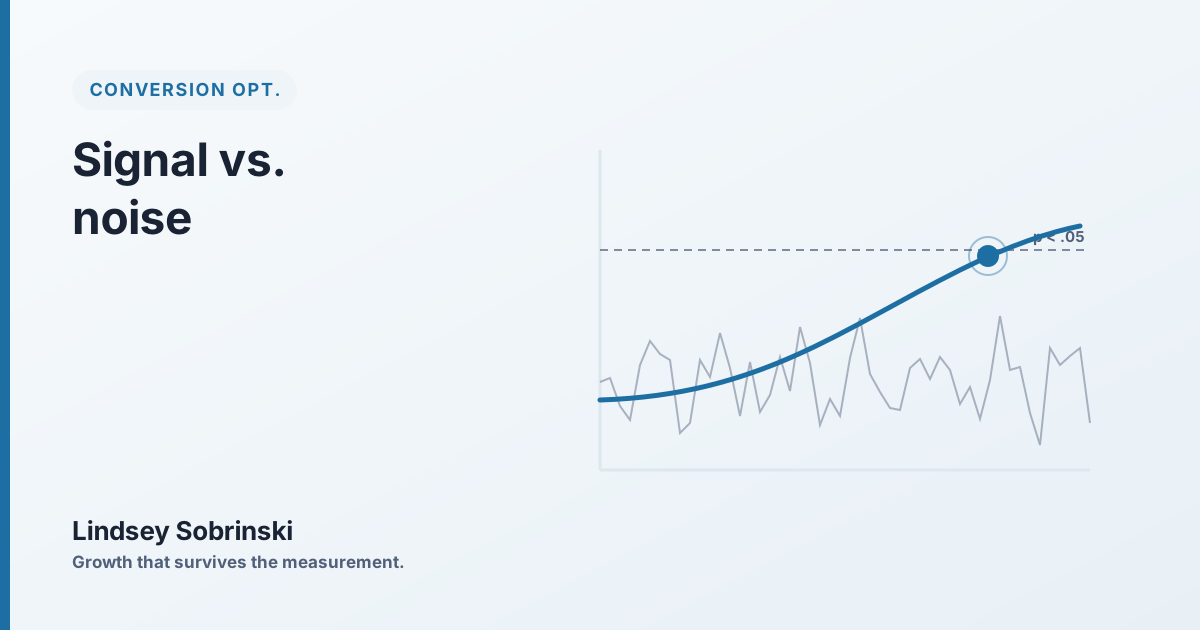
Here’s the pattern. You launch a test. On day three, variant B is up 12% and the line is green. Someone screenshots it in Slack. On day six it’s up 6%. On day nine it crosses p<0.05 for the first time and you call it, declare the winner, ship it, move on.
That is not a valid test. It’s a slot machine you stopped pulling the moment it paid out.
A p-value of 0.05 means: if there were truly no difference, you’d see a result this extreme 5% of the time by chance. That guarantee only holds if you look once, at a sample size you fixed in advance. Every additional peek is another roll of the dice. Check a null test daily for two weeks and your odds of seeing “significance” at least once aren’t 5%, they’re closer to 30%. Peeking doesn’t bias your results a little. It quietly triples or quadruples your false-positive rate.
Random data wanders. Early in a test the sample is small and the swings are wild, so a green line on day three tells you almost nothing. Waiting for it to cross a threshold you didn’t pre-commit to isn’t rigor. It’s confirmation bias with a dashboard.
You never had the traffic to detect it
Before you launch, you owe yourself one uncomfortable calculation: how big a lift do you actually need to see, and how many conversions does it take to see it reliably?
That’s the MDE-and-power question, and it’s not optional. Pick your minimum detectable effect, the smallest true lift worth catching. Pick your power, usually 80% (the odds you’ll detect a real effect that’s actually there). Those two numbers, plus your baseline rate, fix your sample size before a single visitor hits the page.
Run the math once and the hard truth falls out. Detecting a 2% relative lift on a 3% baseline conversion rate takes tens of thousands of conversions per arm. Most sites don’t have that in a month. If your traffic can only detect a 20% lift, you cannot detect a 20% lift, and the vast majority of real UI changes don’t produce one.
Button colors, headline tweaks, form-field reordering, the honest true effect of most of these is small. A few percent, if that. Small true effects need large samples. A small site running weeklong tests on minor changes isn’t finding small lifts. It’s finding noise and calling it insight. The move isn’t to test harder. It’s to test bigger changes, or to stop pretending underpowered tests mean anything.
Every extra metric is another coin flip
Then there’s the volume problem. You run a four-variant test. You watch conversion, AOV, bounce, and add-to-cart. That’s a dozen-plus comparisons, and at 5% each you’d expect roughly one to look “significant” by pure chance.
So one lights up green, and you ship the variant “because it moved AOV.” You’ve mistaken the expected behavior of random noise for a finding. Test many things without correction and you are manufacturing false positives on schedule. Pre-commit to one primary metric, or correct your threshold for the number of comparisons. Pick both after the fact and you’ll always find a story.
The discipline that fixes it
None of this requires a statistician on staff. It requires refusing to decide anything after you’ve seen the data.
- Pre-register the test. Before launch, write down the hypothesis, the single primary metric, the required sample size, and the stop date. If it’s not written before traffic starts, it doesn’t count.
- Run full business cycles. Weekday buyers differ from weekend buyers. B2B pipelines breathe monthly. Stop at a clean multiple of your cycle, not the day the p-value blinks green.
- If you must monitor, use sequential testing. Methods built for continuous looks, sequential tests, group-sequential boundaries, let you peek honestly because they price the peeking in. Standard significance tests don’t. Don’t fake one with the other.
- Hold back a validation slice. Keep a small holdout off the “winning” experience. If the lift is real, it shows up there too. If it evaporates, you just dodged shipping noise to 100% of traffic.
- Track the aggregate. Your top-line conversion rate is the only scoreboard that can’t be gamed. If it isn’t moving the way your stack of wins predicts, your wins aren’t real. Believe the aggregate.
What to do first
Open your last ten “winning” tests. For each, check three things: was the sample size fixed before launch, was there one pre-declared primary metric, and did you stop on a pre-set date or the moment it went green. Most will fail at least one. Those aren’t wins. They’re the reason your aggregate is flat.
Then run the sample-size math for the next test on your roadmap, honestly. If your traffic can’t detect the effect you’re hoping for, kill the test before it wastes a month.
A rigorous program ships fewer wins. That’s the point. The ones it ships are real, and you can prove it. The rest of the industry is celebrating coin flips.